


Central Reporting & KPIs
Central reporting and KPIs for multi-location clinics.
Eliminate guesswork and gain total visibility into your clinical enterprise. Clinicmaster aggregates data from every location into a unified executive dashboard — empowering you to make informed decisions that drive growth, efficiency, and profitability across the entire network.
Central Reporting
Clinicmaster Central Reporting aggregates data from every clinic in your group into one executive dashboard — network revenue, appointment volume, utilization, A/R aging and provider productivity — refreshed on demand. It's native to Clinicmaster, so there's no separate BI tool to license or connect.
Five benefits for the executive team.
Built for the leaders who run the network — not the people who pull the spreadsheets. Every metric you need to steer the business, in one place, on demand.
Executive-level decisions
Transform raw data into actionable insights that let directors and owners steer the organization with confidence — not gut feel.
Performance benchmarking
Compare clinic performance side-by-side to identify the locations leading the network and the ones that need operational support.
Growth opportunities
Spot high-performing services and locations to guide expansion, hiring, and resource investment across the group.
Operational oversight
A constant pulse on network-wide utilization and efficiency metrics — making sure every branch meets your standards.
Consolidated security
Access group-wide reports through a secure, centralized hub aligned with HIPAA and PIPEDA requirements across every location.
How Central Reporting actually works.
Scheduling, billing and charting from every clinic feed one native analytics engine — so every dashboard and report below is the real thing, spanning the whole group. Scroll to walk through it.
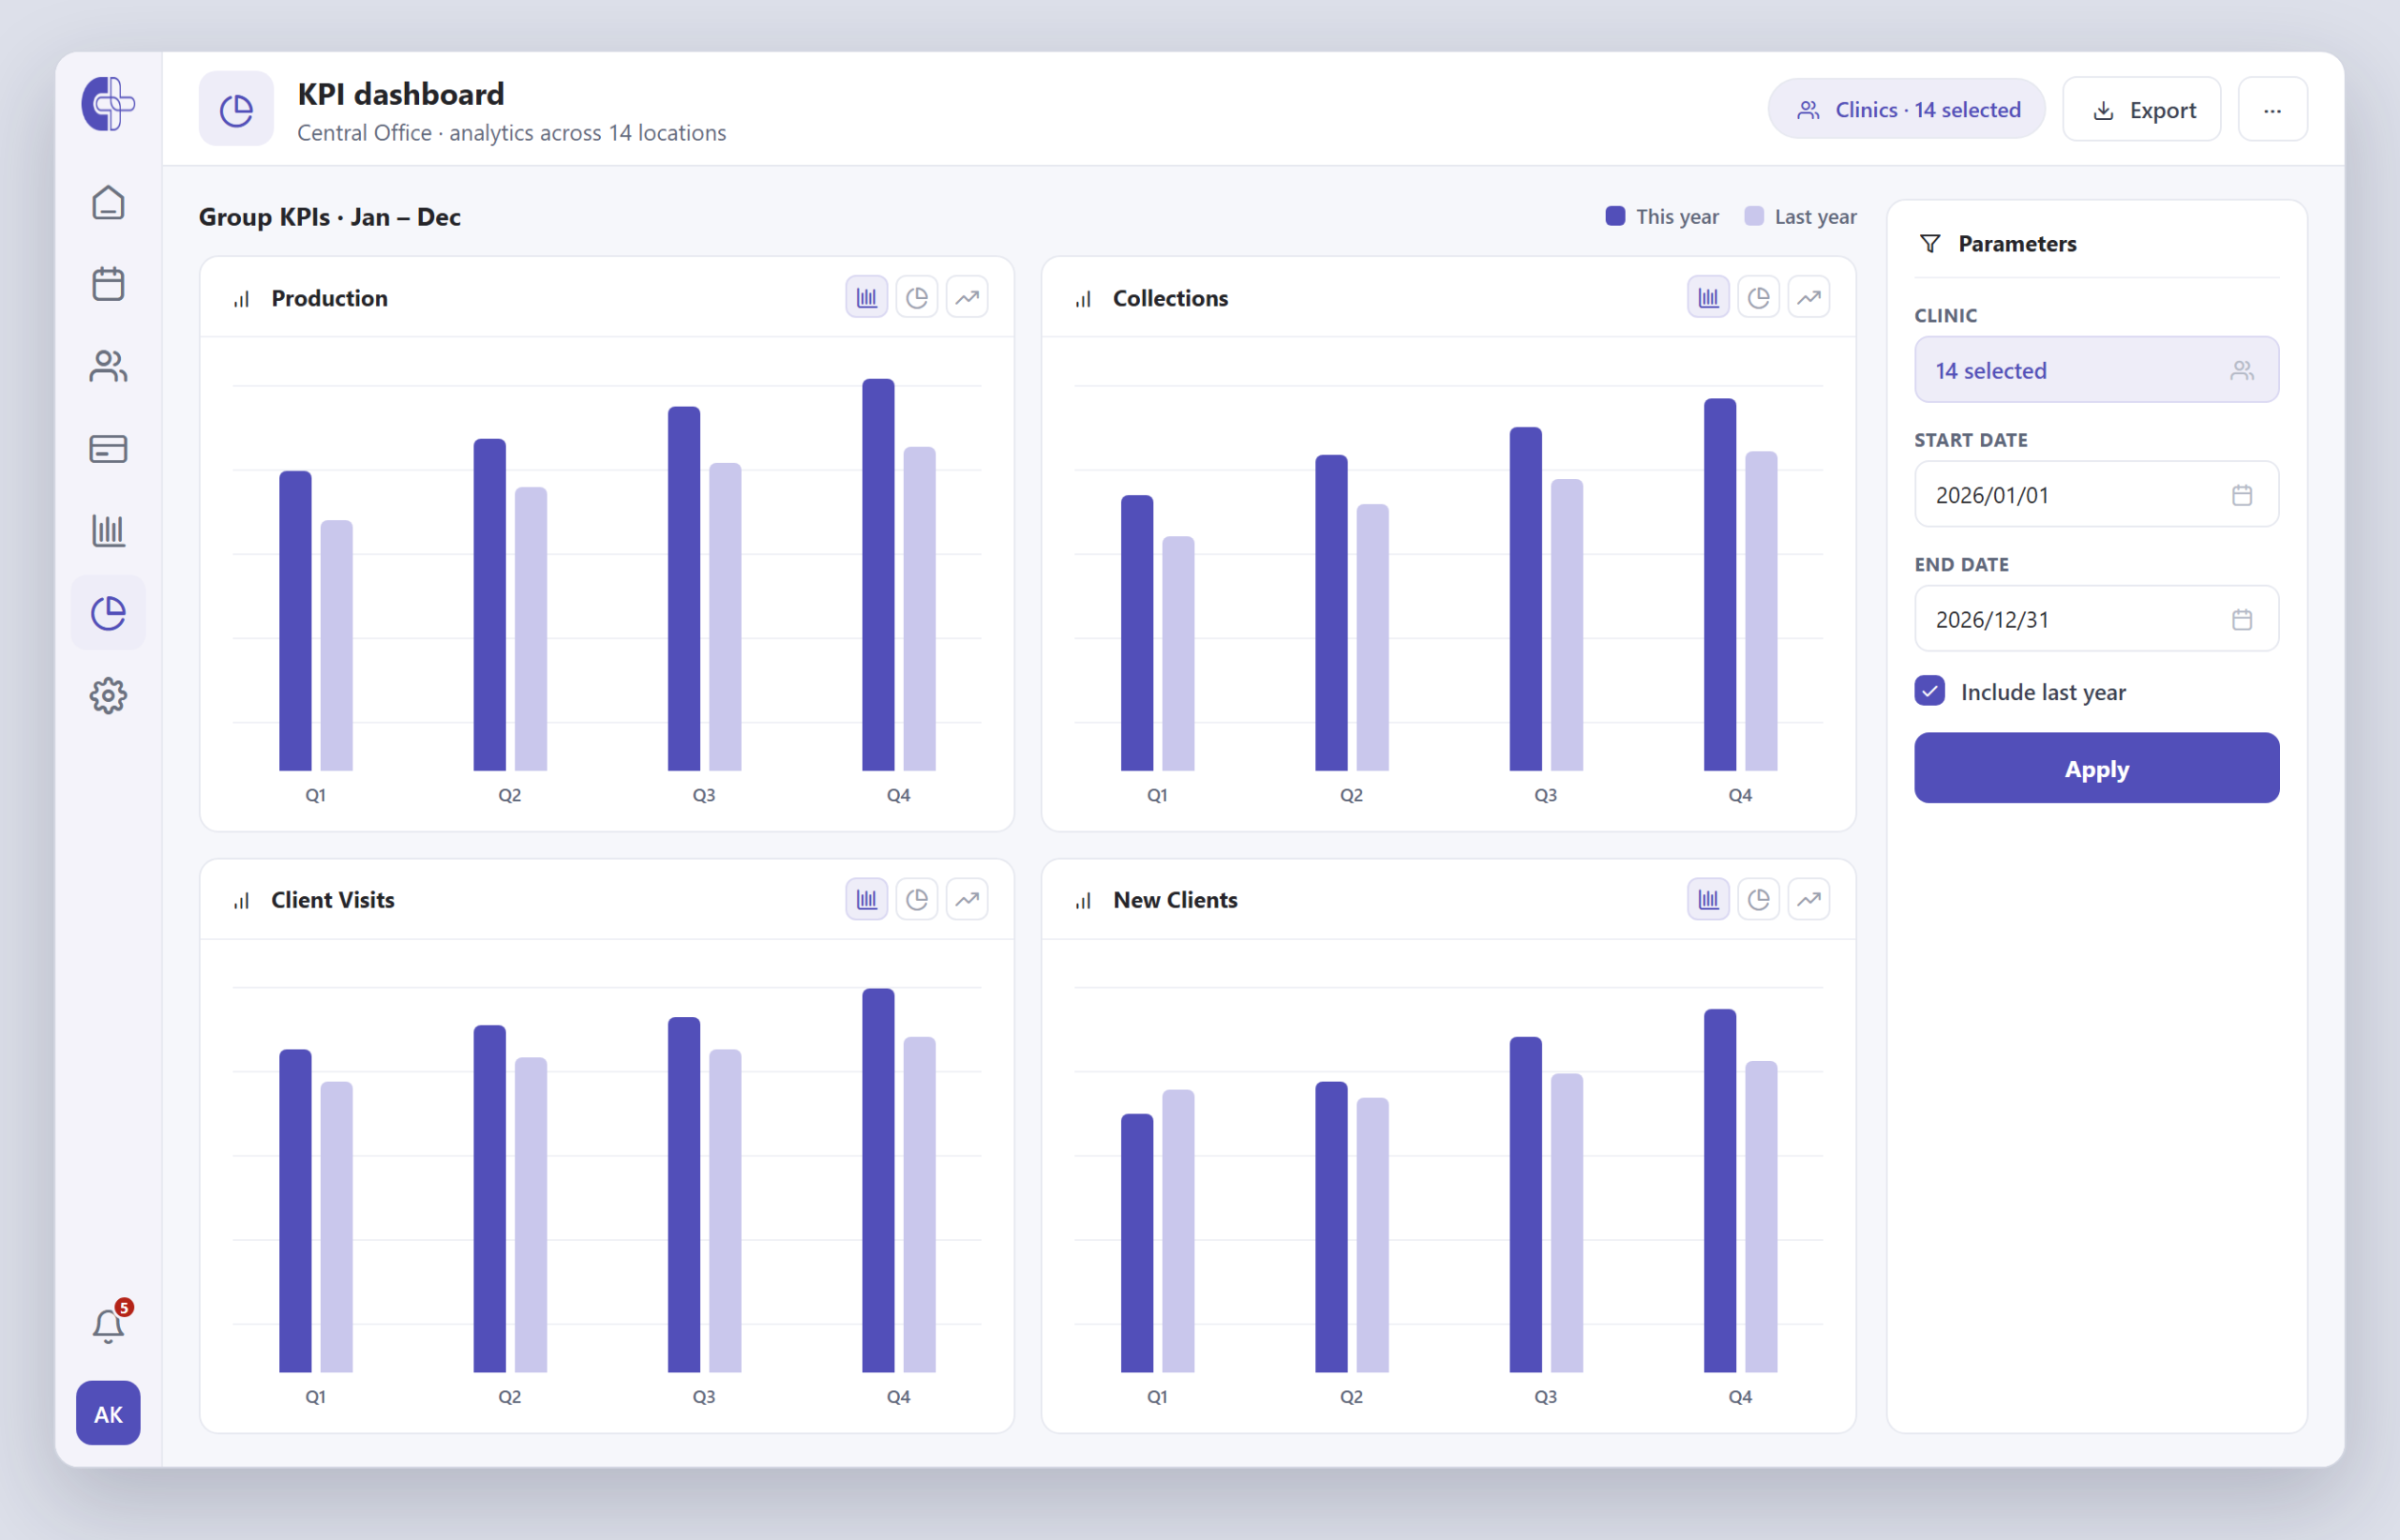
Every group KPI on one screen.
Scheduling, billing and charting from every branch roll into one consolidated dashboard — production, collections, visits and new clients, this year vs last. No spreadsheet merging: pick your clinics and a date range, then Apply.
- Data from every clinic, consolidated
- This year vs last year, on demand
- Bar, pie or trend per metric
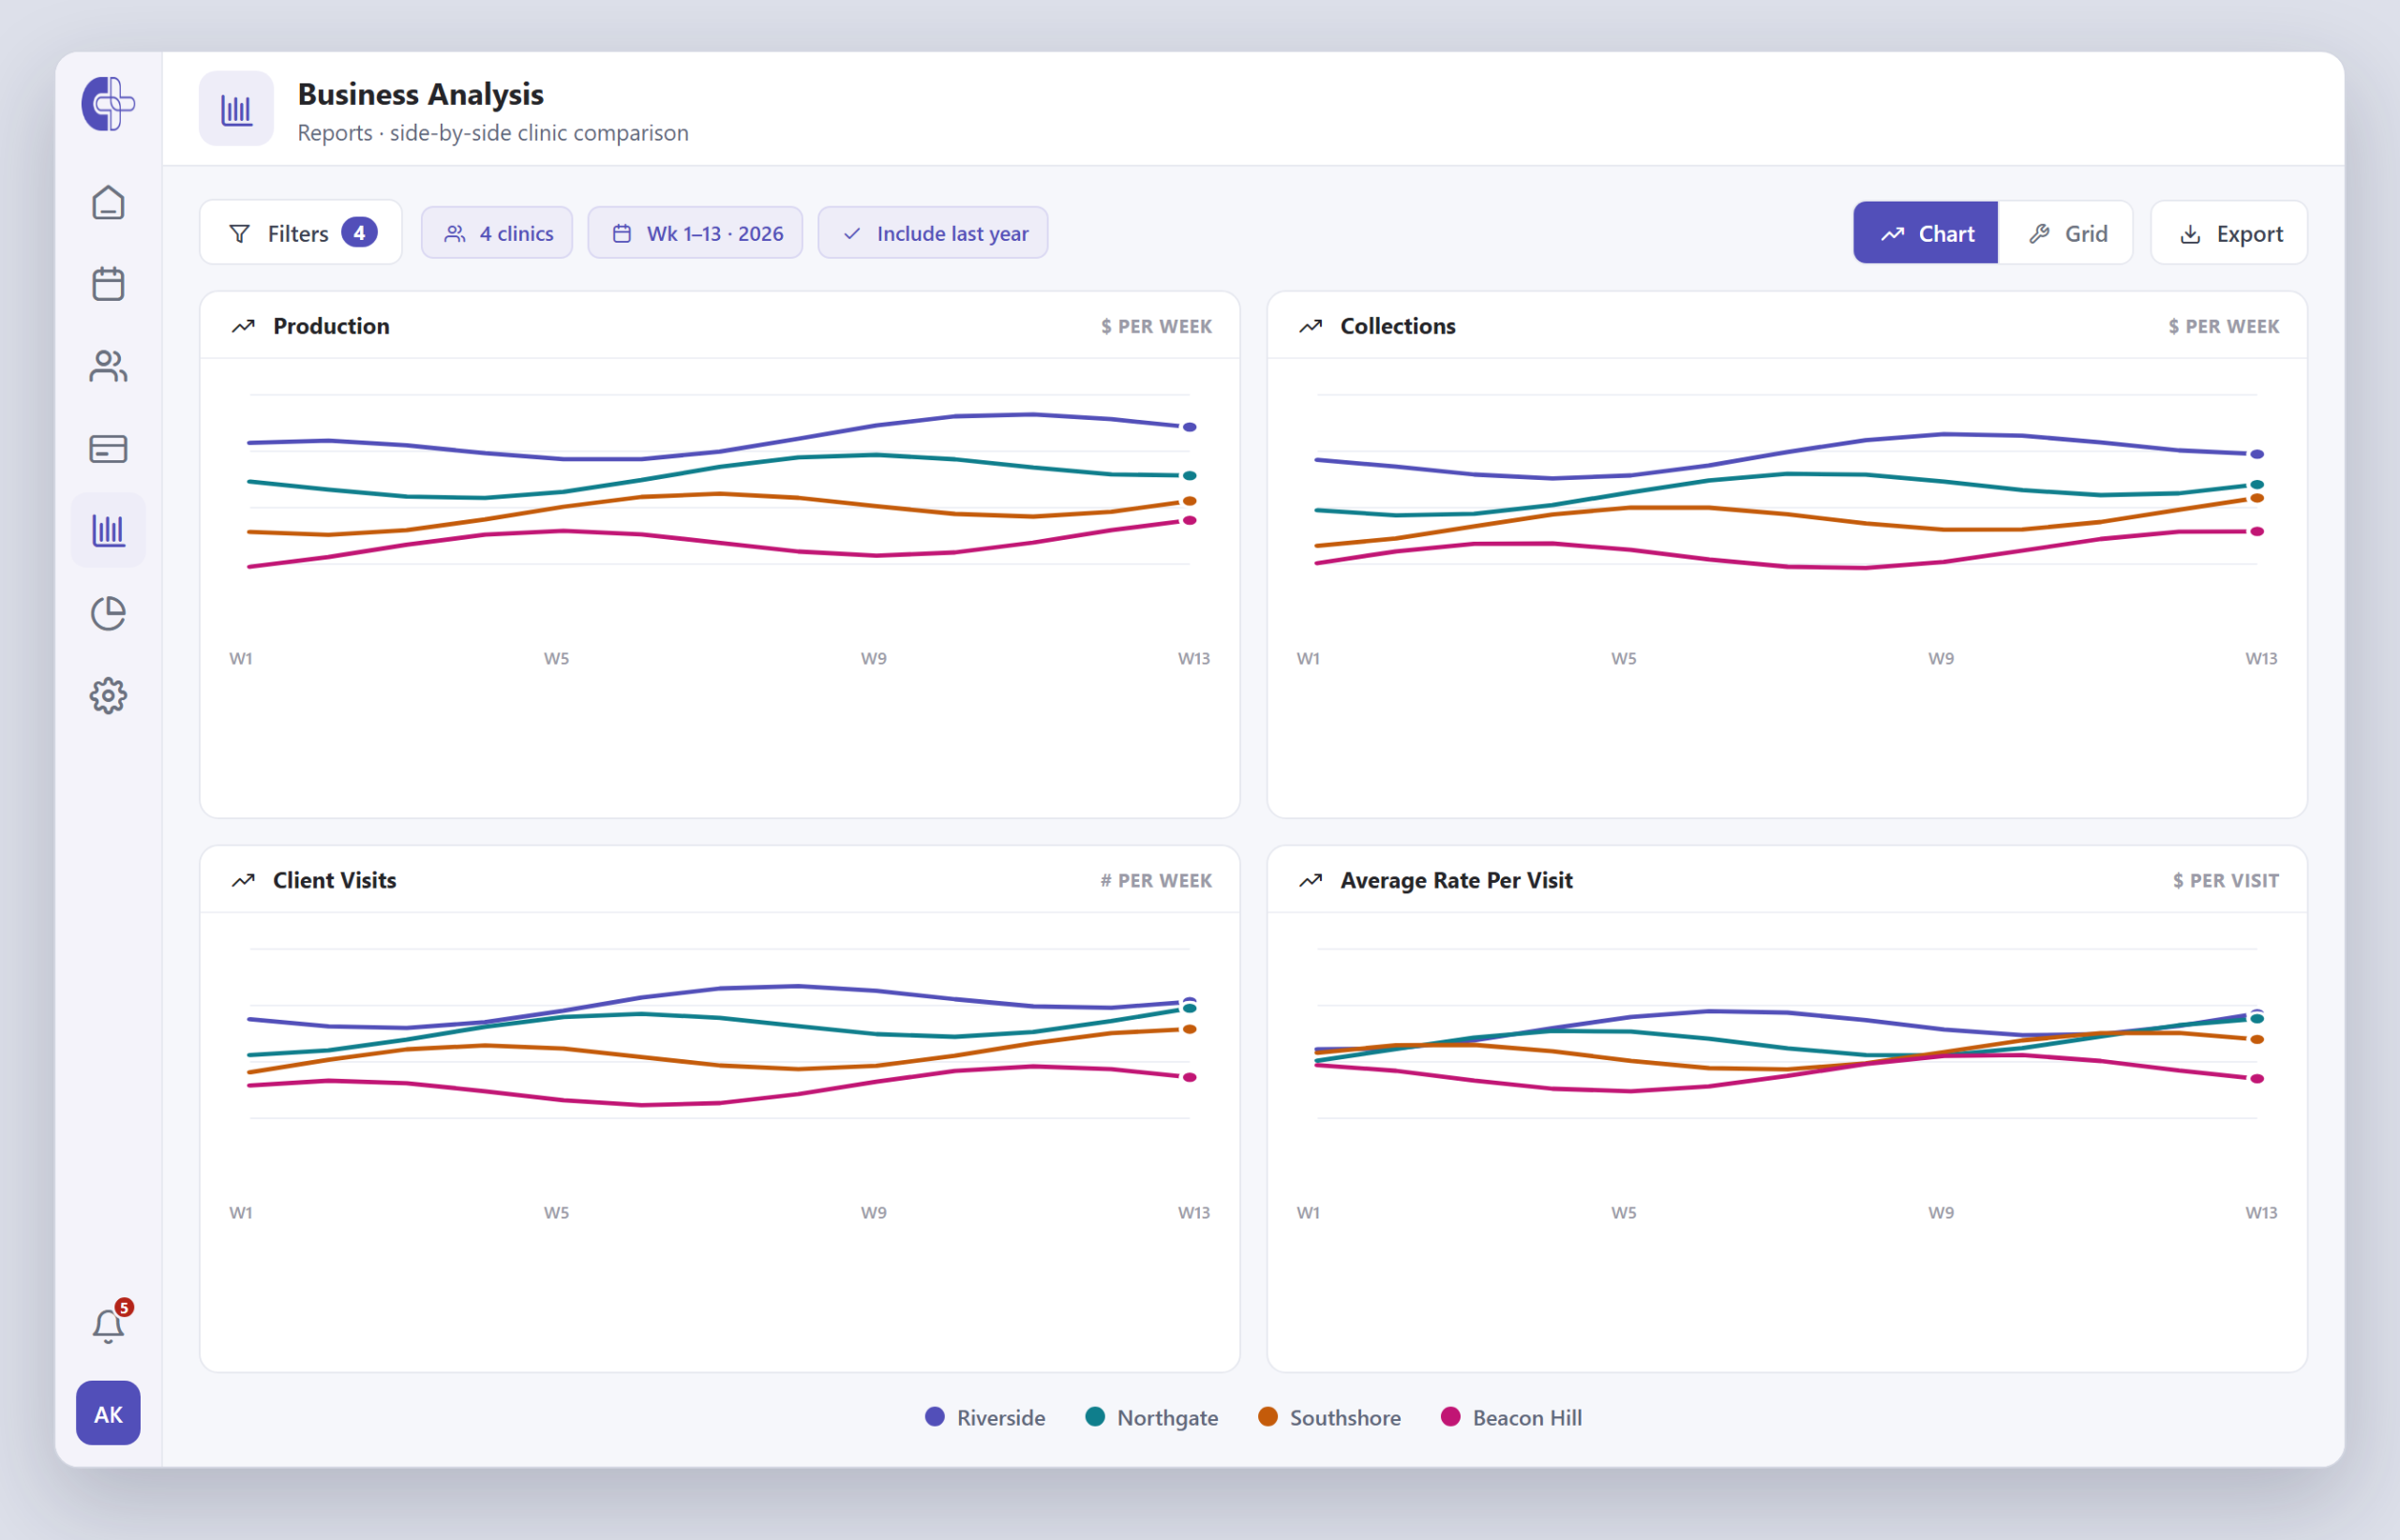
Compare every clinic on the same axes.
Business Analysis plots one line per clinic for production, collections, visits and average rate per visit over weekly periods — so the sites leading the network and the ones that need support are obvious at a glance. Flip to a data grid any time.
- One line per clinic, per metric
- Weekly periods, optional prior year
- Chart view or full data grid
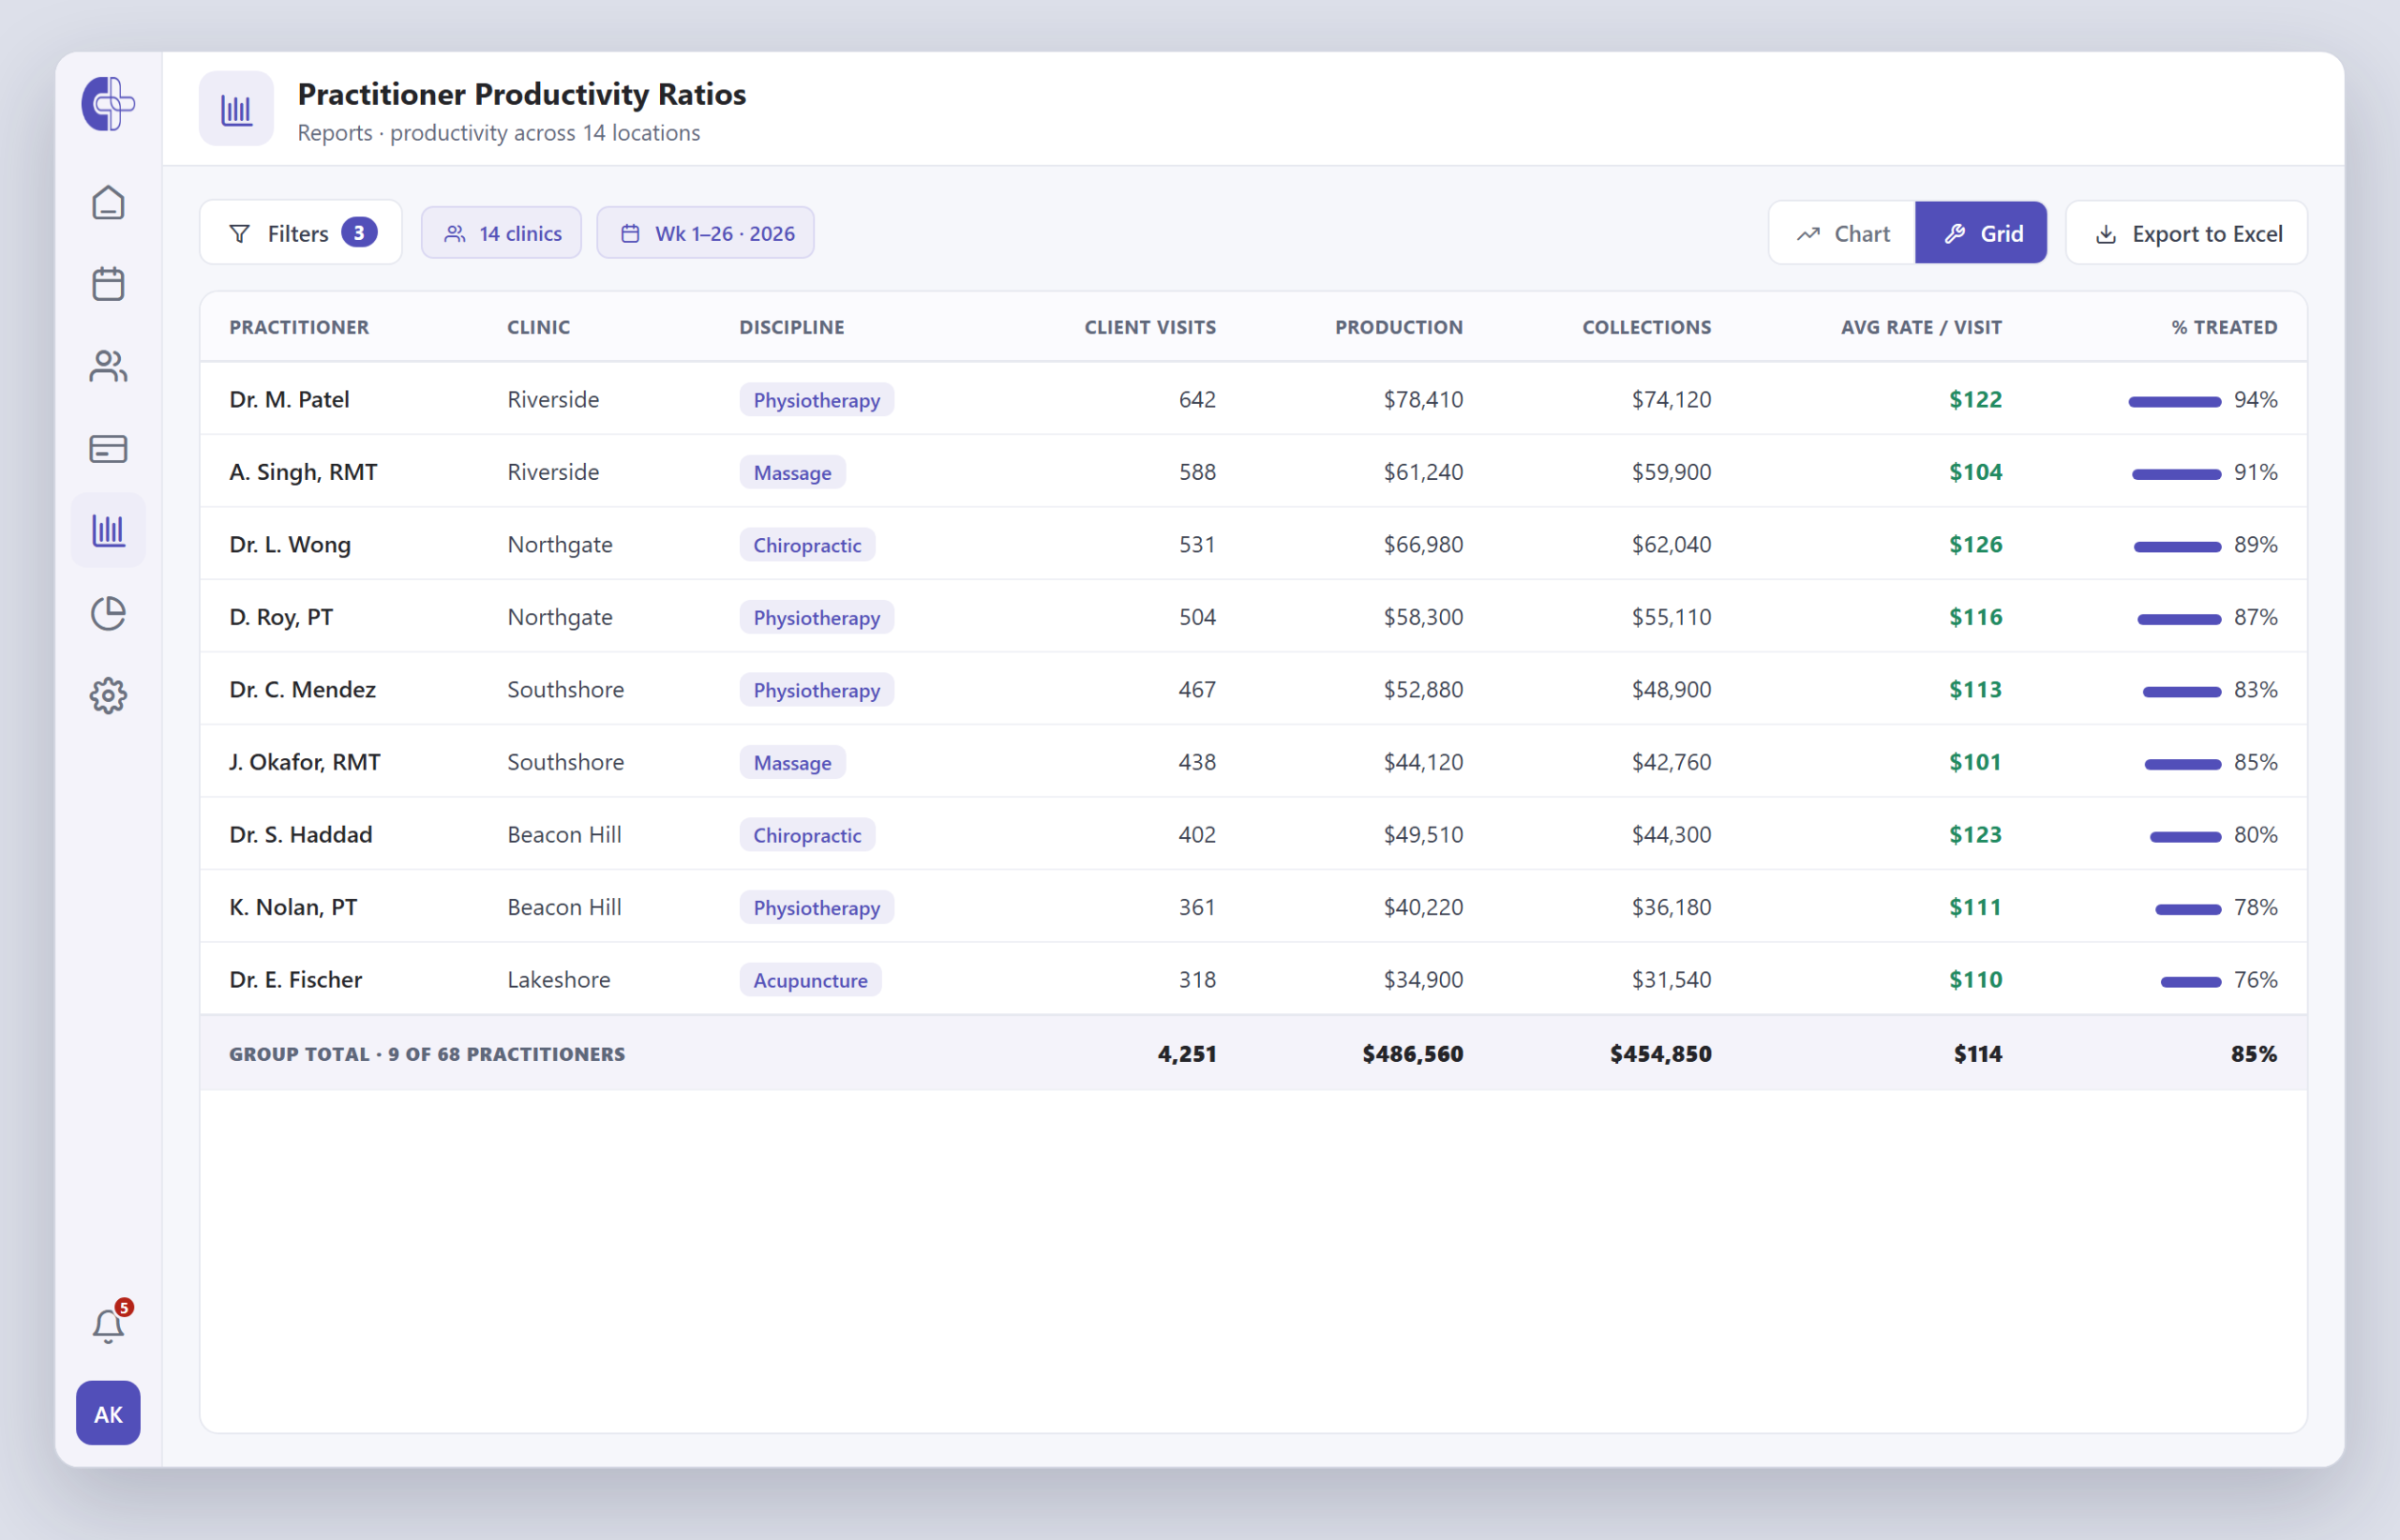
See who is driving the numbers.
The Practitioner Productivity Ratios report ranks every provider across the group by visits, production, collections, average rate per visit and percent treated — so you can inform staffing and coaching decisions network-wide.
- Provider ranking across all sites
- Visits, production, collections, % treated
- Group totals and Excel export
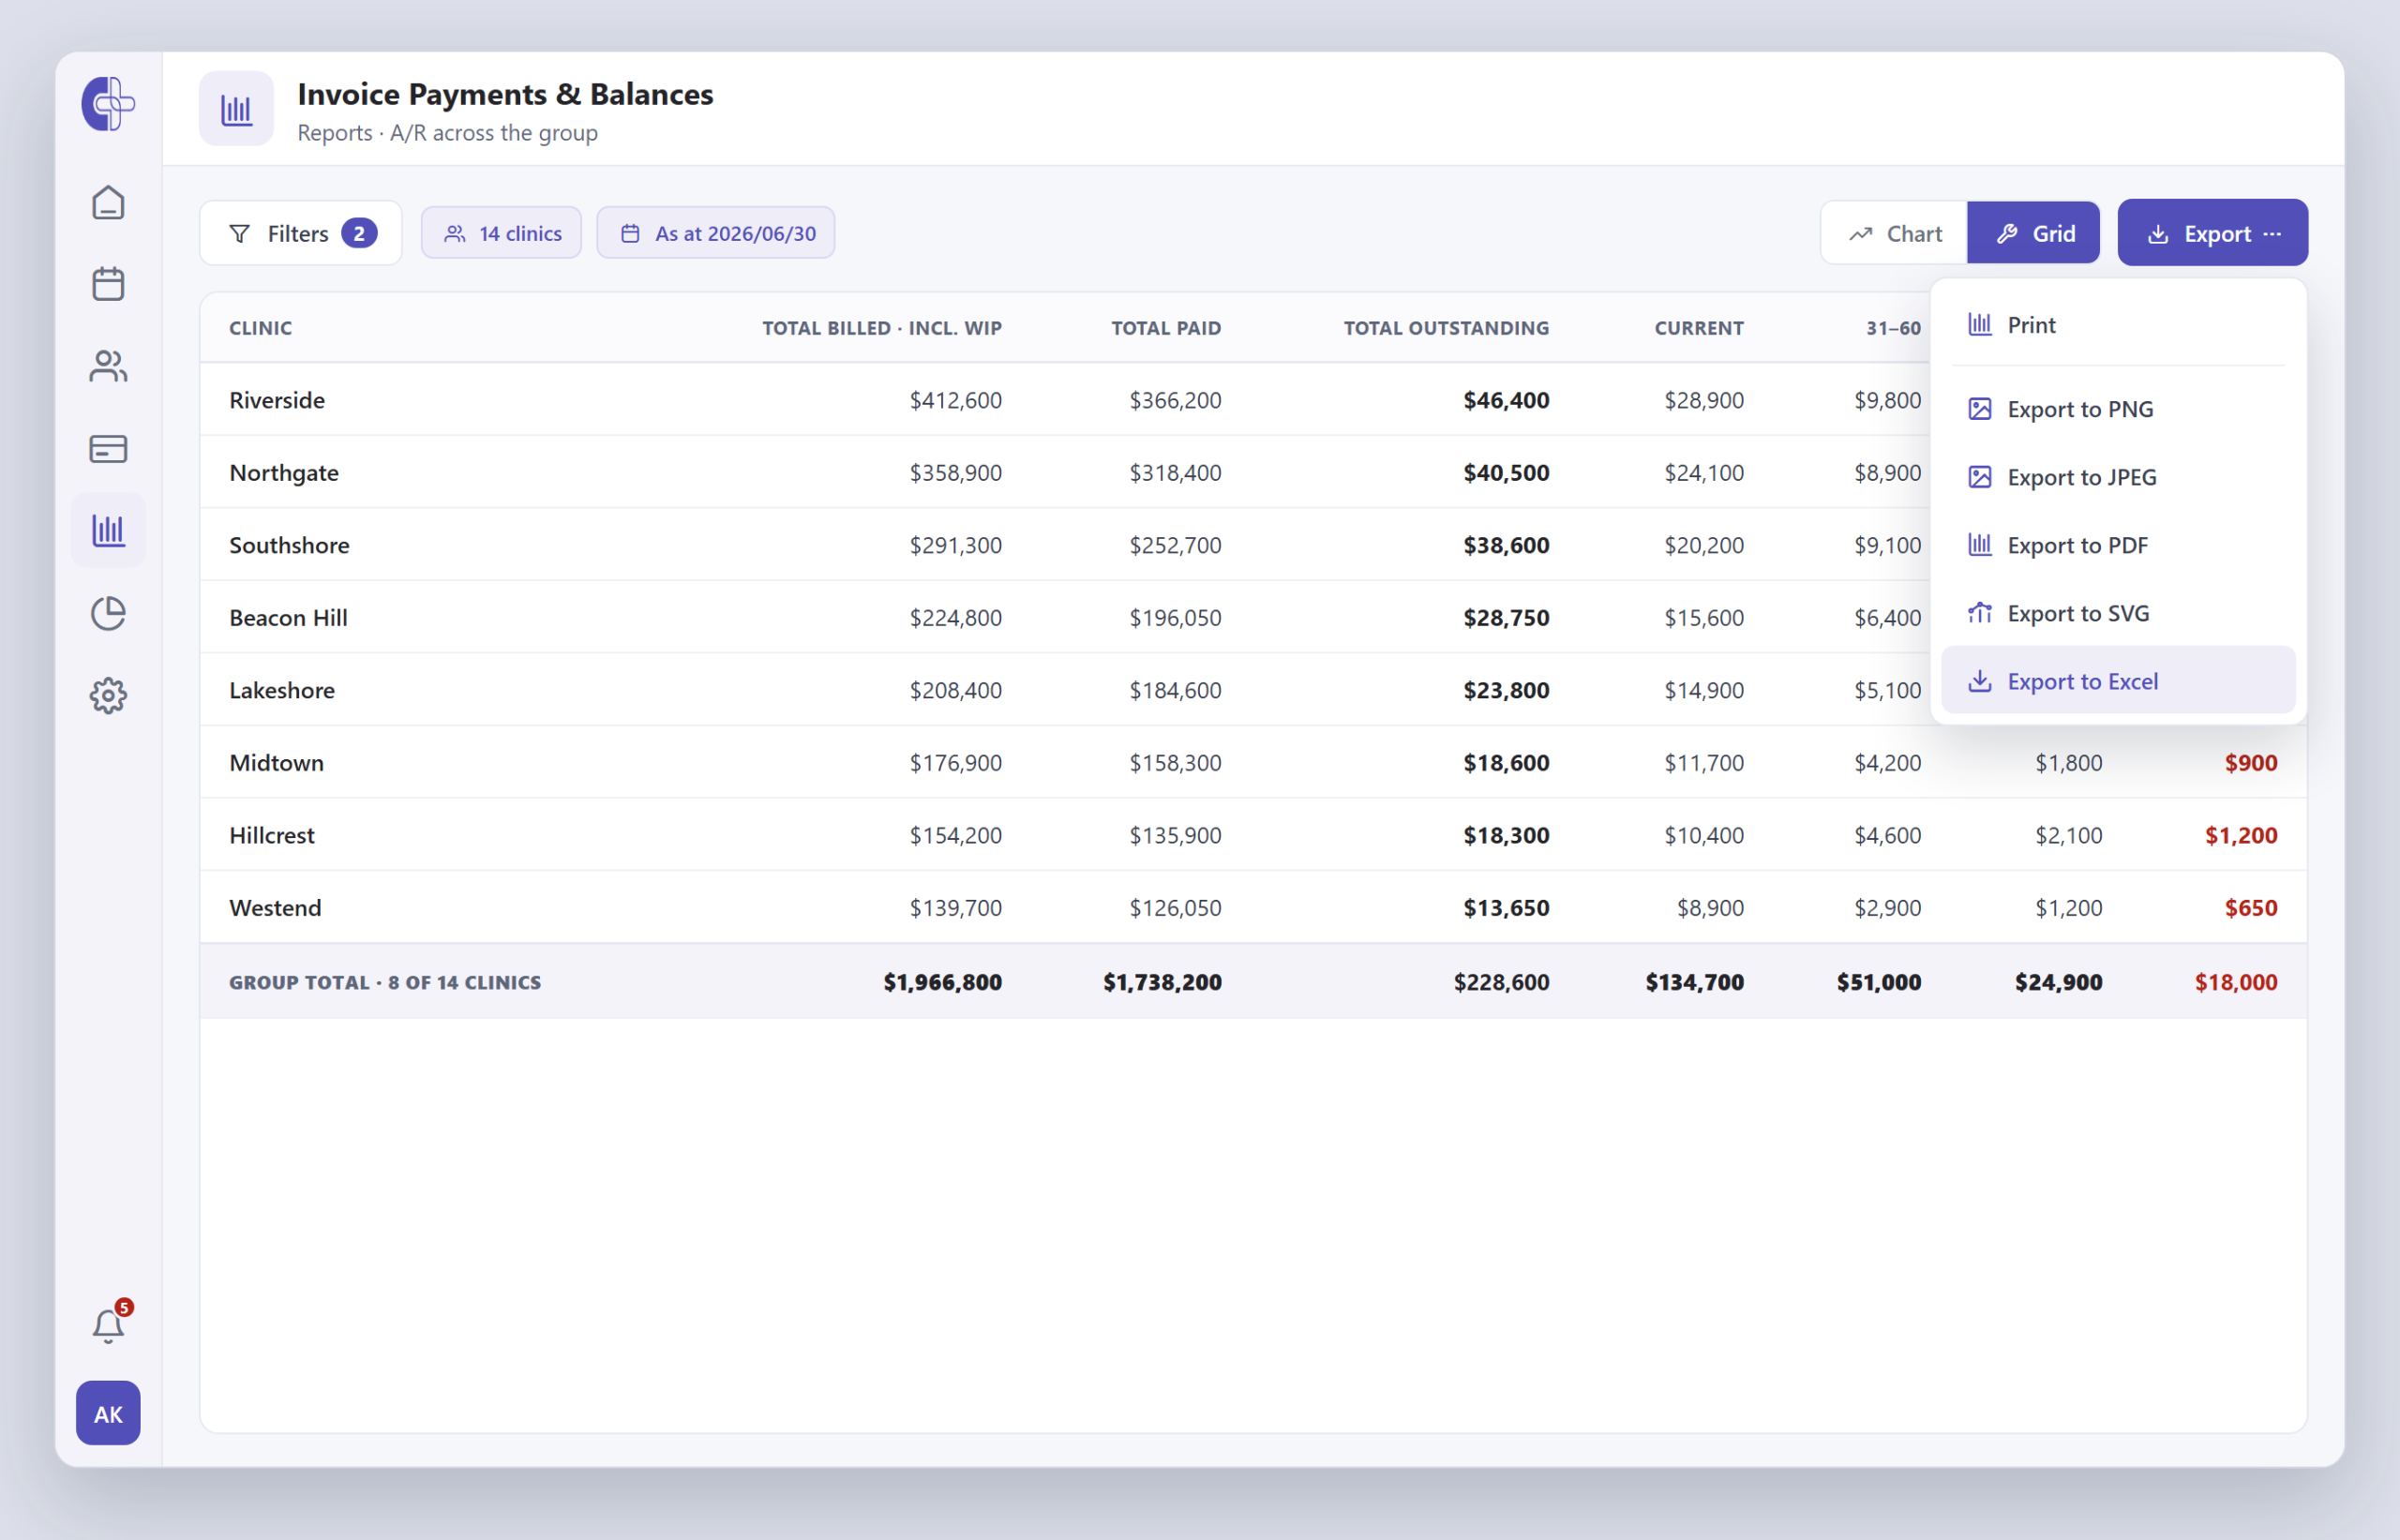
Find the A/R — by location, in seconds.
Invoice Payments & Balances rolls up total billed, paid and outstanding for every clinic, with aging buckets that show exactly where receivables are piling up. Export the board pack to Excel, PDF or image in a click.
- Billed, paid and outstanding per clinic
- A/R aging buckets (current → 90+)
- Export to Excel, PDF, PNG, JPEG or SVG
Analytics at the scale clinic groups already run on.
Ready to see Central Reporting & KPIs in your group?
Book a 30-minute working session with a solutions engineer. Bring your current workflow — we'll show you exactly how Clinicmaster fits.
Three reporting problems clinic groups bring us first.
What clinic groups actually ask Central Reporting to do.
I need to see which clinics are thriving and which need help — without waiting for end-of-month reports.
Our A/R is creeping up but I can't pin down which location or insurer is driving it.
Are we over- or under-staffed? I have no idea — and demand changes weekly per site.
Built for the teams who steer the network.
Multi-location owners
Side-by-side clinic comparisons to identify which sites are thriving and which require intervention.
Executive directors & CEOs
Shift from the daily grind to the big picture. Revenue, A/R, and KPI trends across the group — without waiting for month-end.
Operations managers
Track provider productivity and patient flow across the network. Spot bottlenecks and inform staffing decisions.
Financial controllers & CFOs
Total clarity on the network's finances — A/R and invoice balances across every site, all in one place.
Data-driven decision makers
Prefer evidence over guesswork. Native, built-in analytics — no bolt-on BI tool — to back every strategic move with concrete data.
Regional managers
Cluster-level visibility into the clinics in your region — without seeing data outside your scope.
Native reporting beats bolt-on BI — every time.
Unlike third-party analytics tools, Clinicmaster's reporting is built into the same platform your teams already use every day. No connectors. No sync delays. No extra licensing.
Natively built, not bolted on
Reporting lives inside the same system as scheduling, billing, and charting. Every transaction flows into dashboards automatically — no exports, no middleware.
On-demand, not month-end
Pull up-to-date numbers whenever you need them. Apply your filters and the dashboard returns current data across every location — no month-end wait, no manual spreadsheet merge.
One vendor, one compliance framework
HIPAA- and PIPEDA-aligned safeguards are managed in one place. No separate audits for a third-party BI tool — access controls, audit logs, and data residency under one roof.
No extra BI licensing costs
Enterprise analytics platforms charge per seat and per data volume. With Clinicmaster, reporting is included — every clinic manager sees the same dashboards at no added cost.
Role-based views across locations
Owners see the full network. Regional managers see their cluster. Clinic leads see their site. Permissions are granular and managed centrally.
Zero implementation overhead
No data warehouse to configure, no ETL pipelines to maintain, no integration project. If you run your clinics on Clinicmaster, your central reporting is already there.
Frequently asked questions.
Scale your Organization with Clinicmaster.
30-minute working session with a solutions engineer. Bring your current numbers — we'll show you the gap.